
Too many good options: Nearly 9 in 10 people with debt put off decisions they know they should make
A Rose Cove survey of 1,046 American adults found that choosing between borrowing paths leaves many people waiting. Here is what they told us they need.
Written by Rose Cove Team
Published Oct 22, 2026 · 8 min read
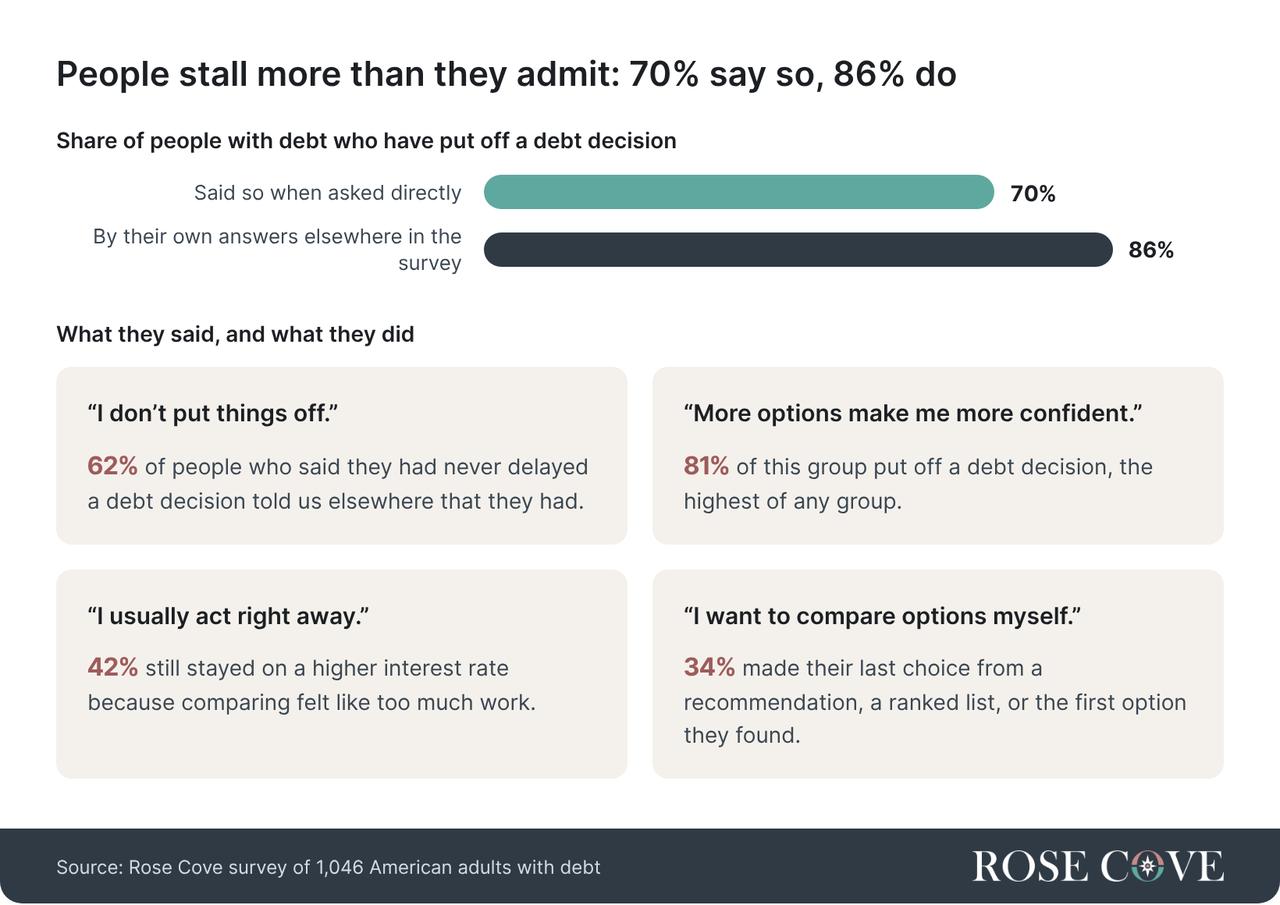
- 86%have stalled on a debt decision. Only 70% admit it.
- 57%paid a higher rate for 4+ months rather than compare options
- 61%trust a “Best of” list less once they learn the site gets paid when they click
Key takeaways
- People stall more than they admit. 7 in 10 say they have put off a debt decision. By their own answers, closer to 9 in 10 have.
- The options are the problem. 36% delayed mainly because there were too many options, they were not sure what fit, or comparing felt like too much work.
- Waiting costs them. 57% stayed on a higher interest rate for four months or more because comparing felt like too much work. 25% stayed more than a year.
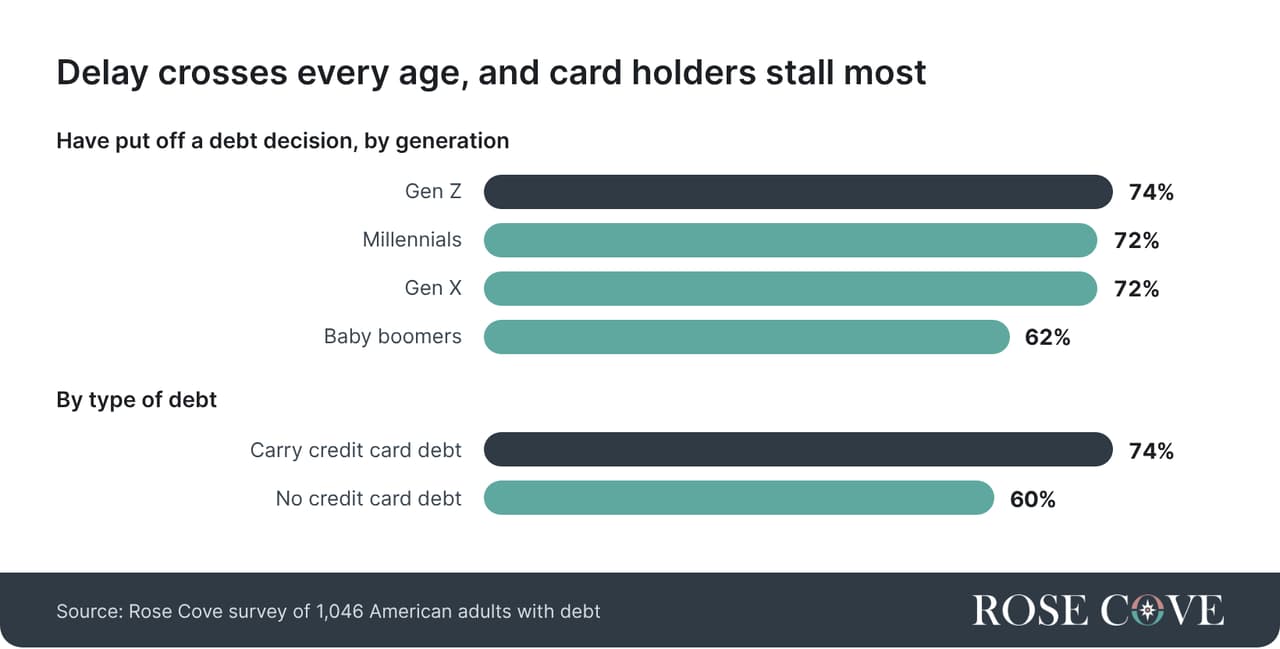
- Card holders stall most. 63% of people with credit card debt stayed on a higher rate for four months or more, compared with 42% of people without card debt.
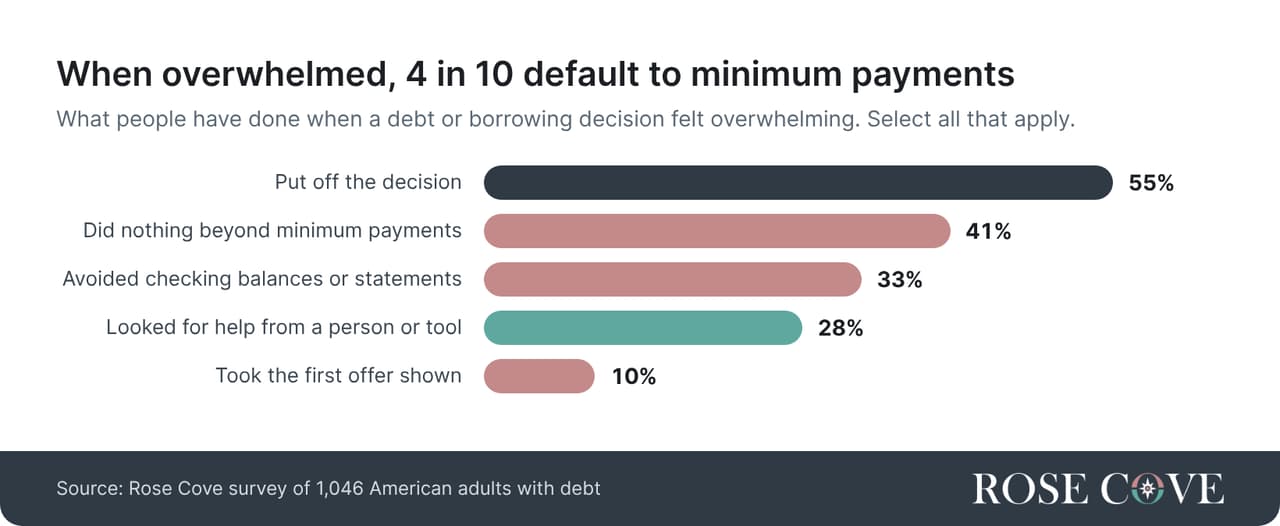
- Overwhelm defaults to minimums. When a debt decision felt overwhelming, 41% did nothing beyond their minimum payments.
- Distrust doesn’t change behavior. 61% trust a “Best of” list less once they learn the site gets paid when they click. Yet 36% of them still trust those lists at least somewhat.
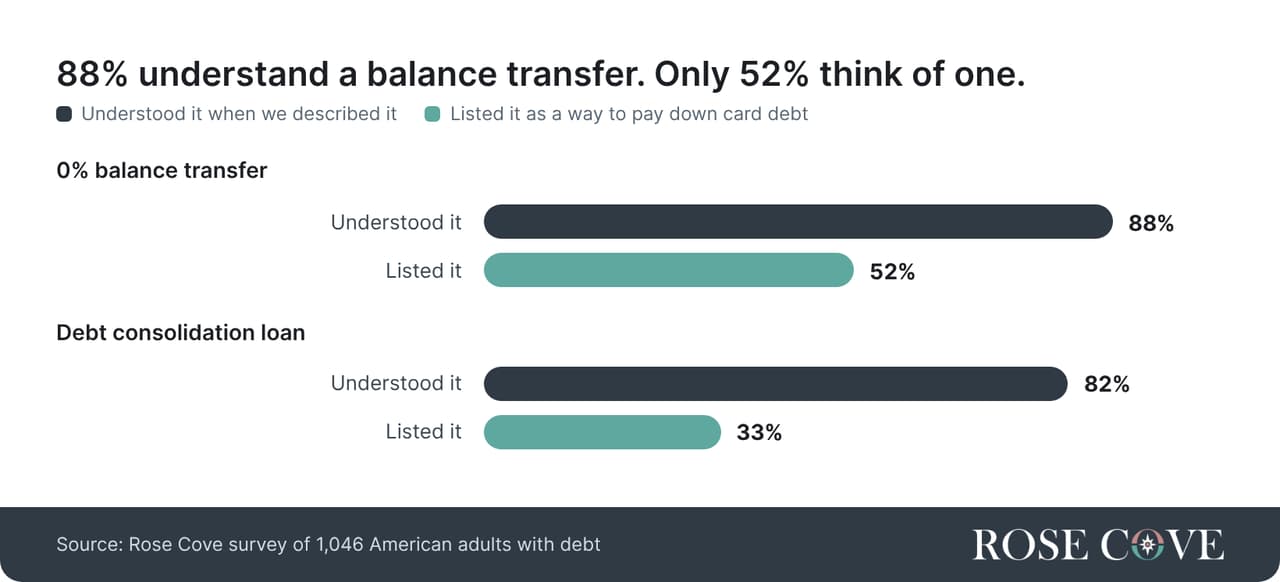
- The best option often goes unnoticed. Only half of people with debt (52%) recognize a balance transfer as a way to pay down card debt.
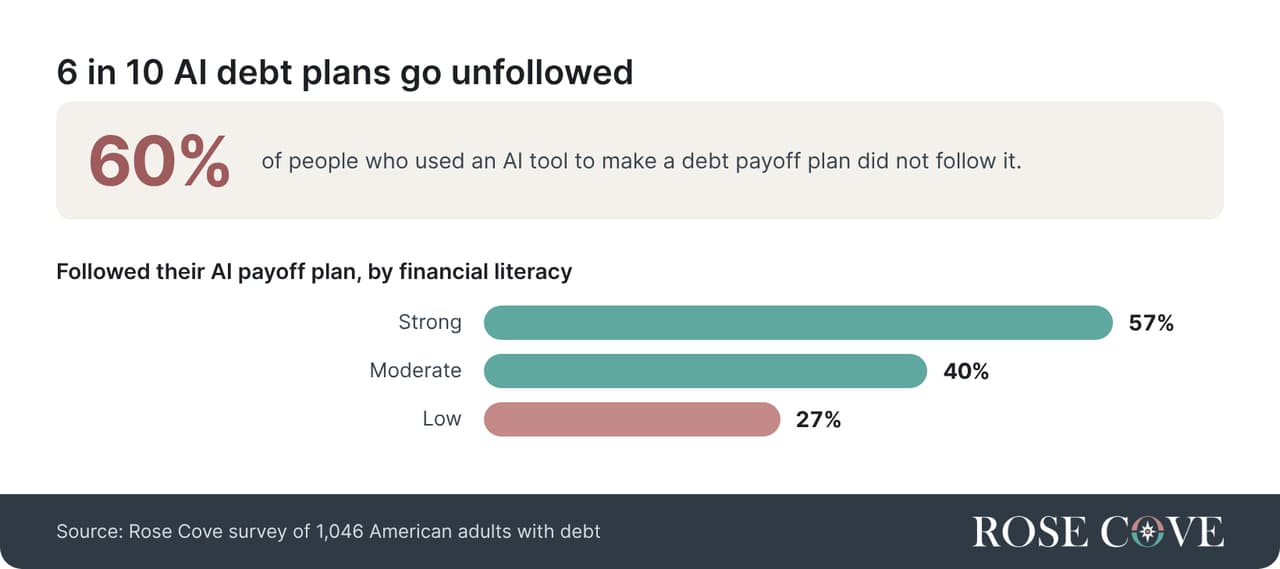
- AI plans get made, not followed. 24% have used AI to build a debt payoff plan. 6 in 10 of them did not follow it.
- The monthly payment misleads. 40% could not tell which of two loans costs less to pay back.
More than a third of Americans with debt have put off a decision because comparing options felt hard, the choices felt overwhelming, or they weren’t sure what fit. In a Rose Cove survey of 1,046 adults with debt, the answers point to one need: clear guidance that helps people understand their choices and feel sure about the next step.
Debt decisions sit for months, and card holders wait longest
Some people delayed choosing a payoff approach. Others put off a balance transfer or a decision about borrowing. For many, the wait lasted months.
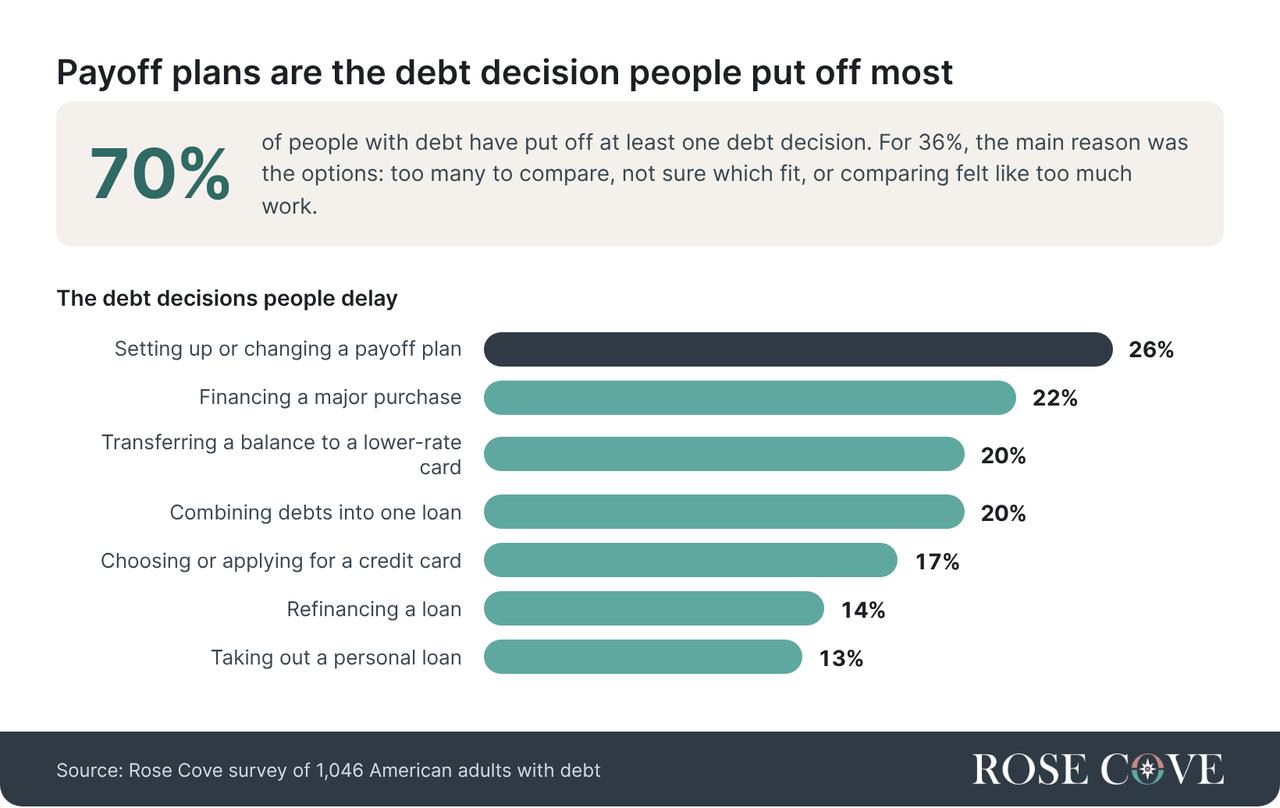
The most common decisions people delayed were:
- Setting up or changing a payoff plan (26%)
- Financing a major purchase (22%)
- Transferring a balance to a lower-rate card (20%)
- Combining debts into one loan (20%)
Delay is common at every age, and highest among people with credit card debt. 74% of card holders have put off a debt decision, compared with 60% of people without card debt. It is not an income story either. At least two in three people in every income group have put off a decision.
Hard choices also led people to freeze. When a debt decision felt overwhelming, the most common response after putting it off was doing nothing beyond the minimum payment.
More than half of people with debt (56%) said a few options help, but too many make the decision harder. Another 18% said more options make them put the decision off. That shows in the wait: 18% of people who say more options make them put decisions off waited more than a year to act, compared with 8% of people who say a few options help.
Most people (83%) said they had stayed at a higher interest rate because comparing options felt like too much work. For 57%, it lasted four months or more, and for a quarter, more than a year. Among credit card holders, 63% stayed four months or more.
That doesn’t mean a lower rate was available to everyone. Still, among people who delayed a debt decision, 89% wished they had acted sooner.
Among people who delayed, the wait often stretched for months. Of that group, 44% held off at least four months, and 21% waited seven months or longer.
People say they act fast. Their answers say otherwise.
Ask people about their debt habits and most describe a careful decision-maker. Ask what they did, and a different picture appears.
Confidence shows a gap too. Men were nearly twice as likely as women to call themselves very confident comparing debt options (27% vs. 15%). Their financial literacy scores were about the same (26% vs. 27% scored strong).
The takeaway is not that people are careless. Comparing debt options is hard enough that even confident, careful people put it off.
Paid rankings lose trust, but people still use them
61% of people with debt trust a “Best of” or “Top 10” list of financial products less once they learn the site gets paid when they click. Just 9% trust it more. But distrust does not always change behavior. Among people who would trust a list less, 36% still trust these lists at least somewhat.
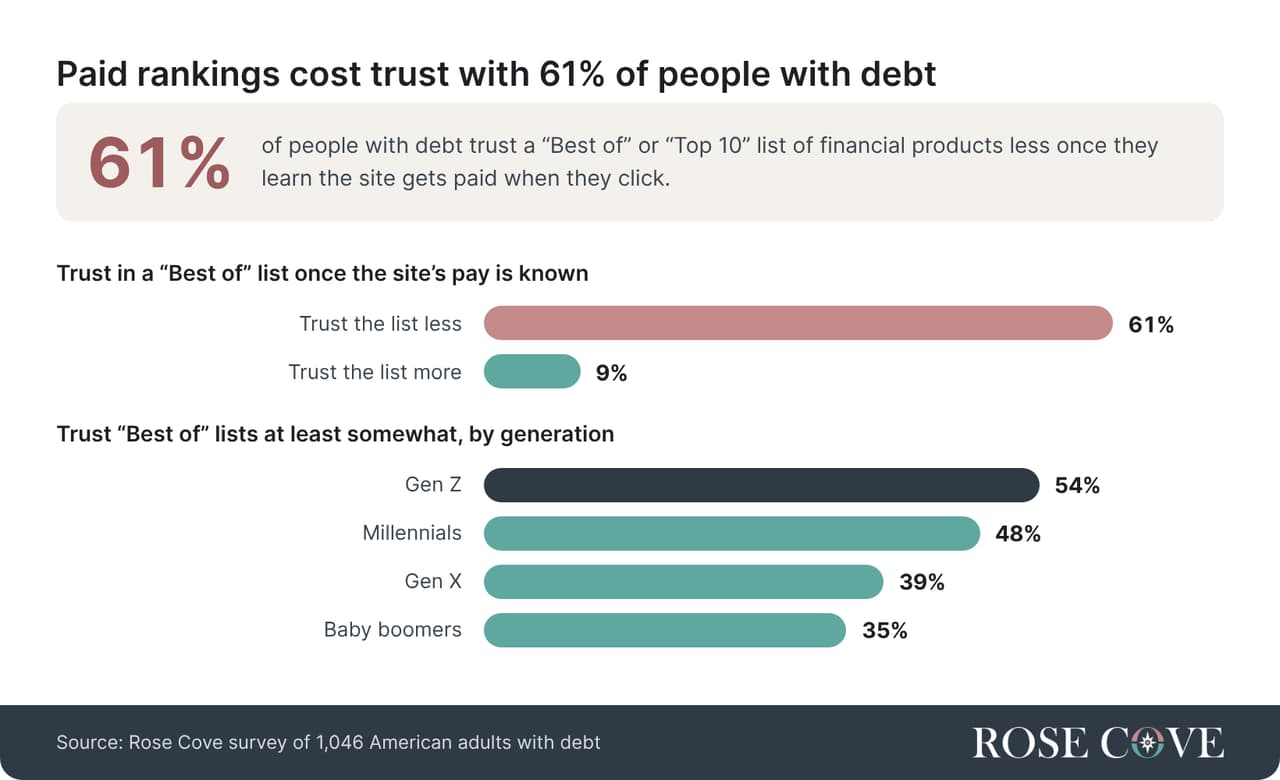
Trust in these lists also falls with age. 54% of Gen Z trust a “Best of” list at least somewhat, compared with 35% of baby boomers.
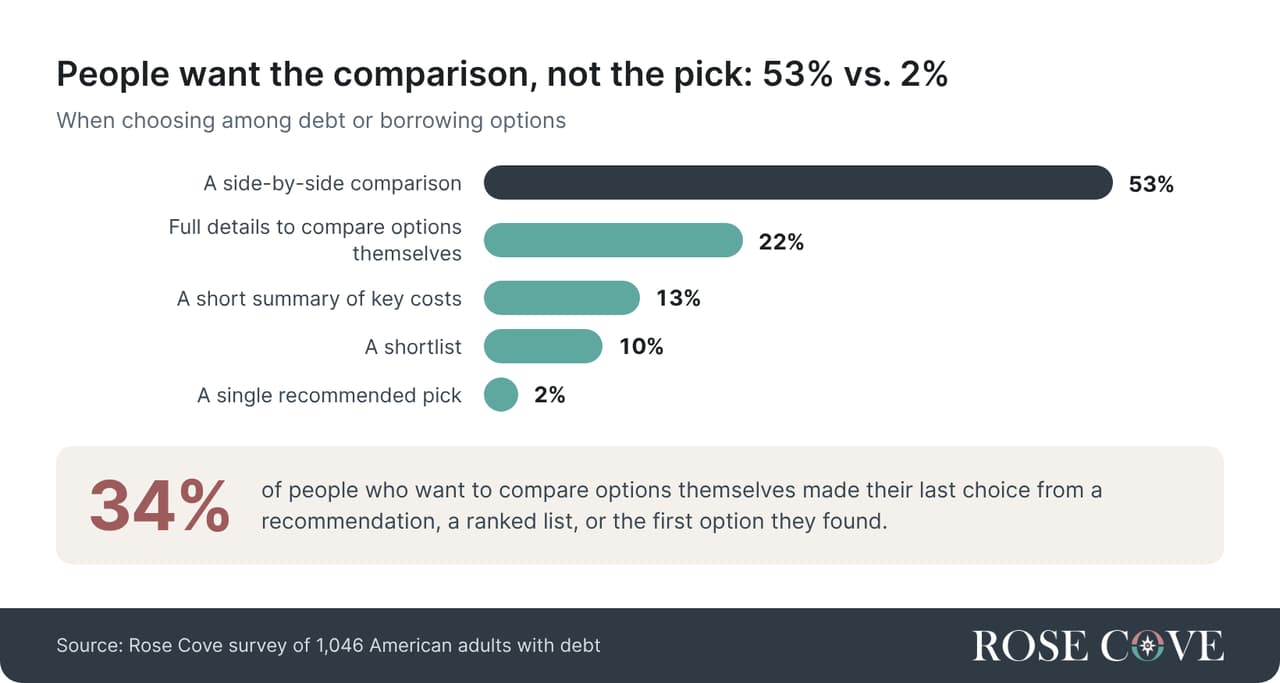
Most people say they compared options on their own (55%) for their last credit card or loan. About 1 in 10 used a ranked list. When asked what would help them choose most:
- 53% wanted a side-by-side comparison.
- 22% wanted full details to compare options themselves.
- 13% wanted a short summary of the key costs.
- 10% wanted a shortlist.
- 2% wanted a single recommended pick.
In a quiz question shown to about half of respondents, nearly 4 in 5 (79%) correctly spotted that a “Best Overall” pick could be paid for and might not fit their needs.
These answers point to a clear job for financial guidance: explain why an option fits. People need to see the trade-offs behind a recommendation. Guidance has to show its work.
The cheapest option is often the one people miss
Choosing well takes more than lining up offers. People also need to understand what the numbers mean.
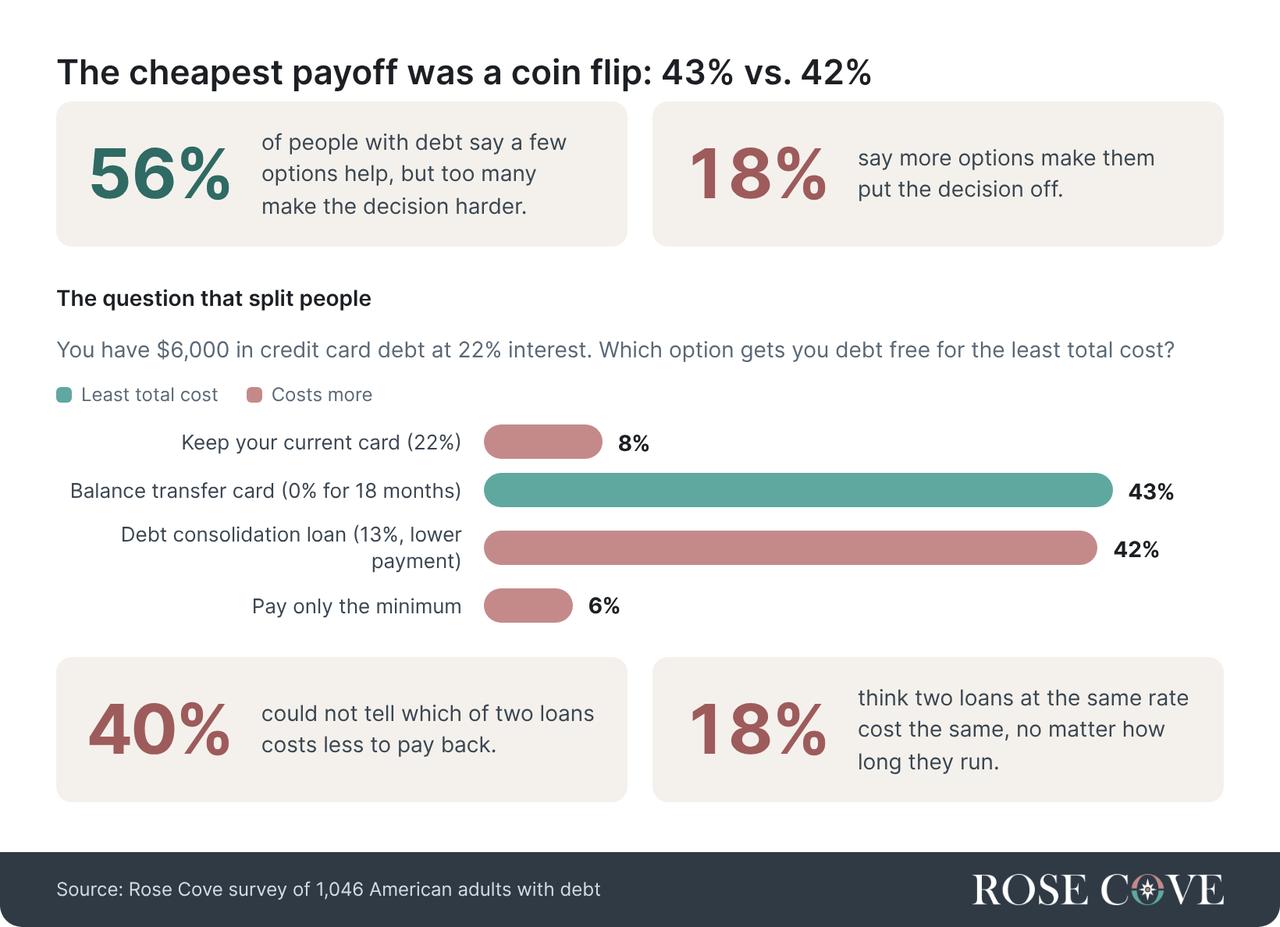
40% could not spot the cheaper loan. One survey question showed two loans with the same balance and interest rate. One had lower monthly payments over a longer period. The other had higher payments and a faster payoff. In this example, the faster payoff cost less overall. 17% picked the loan with the lower monthly payment, and 18% thought the two cost about the same. Just 67% knew that the APR, not the monthly payment, shows a loan’s true yearly cost.
The cheapest way to clear a $6,000 card balance split people almost evenly. A second question asked how to clear $6,000 of credit card debt at 22% interest for the least total cost. 43% picked a balance transfer card with 0% for 18 months, the lowest-cost choice. 42% picked a consolidation loan with a lower payment. Test your own numbers in the Balance Transfer Calculator.
Older people did better. About 7 in 10 Gen X (72%) and baby boomers (71%) picked the cheaper loan, compared with 54% of Gen Z and millennials.
Many people also do not think of all their choices. More than a quarter (28%) recognized only one way to pay down credit card debt from a list of approaches. Only half (52%) picked a balance transfer, even though 88% knew how one works when we described it.
Others turned to AI for help. Nearly a quarter (24%) had used an AI tool to create a debt payoff plan, and another half of all respondents (51%) said they would consider it. But 6 in 10 AI users did not follow their plan. Follow-through tracked financial literacy: 57% of strong scorers stuck with their plan, compared with 27% of low scorers. A plan helps only if it still makes sense a month later.
Lower literacy means more shortcuts and fewer plans followed
Only 1 in 4 people with debt got all five money questions right. To put a number on it, Rose Cove scored each person on the money questions they answered and sorted them into strong, moderate, and low financial literacy.
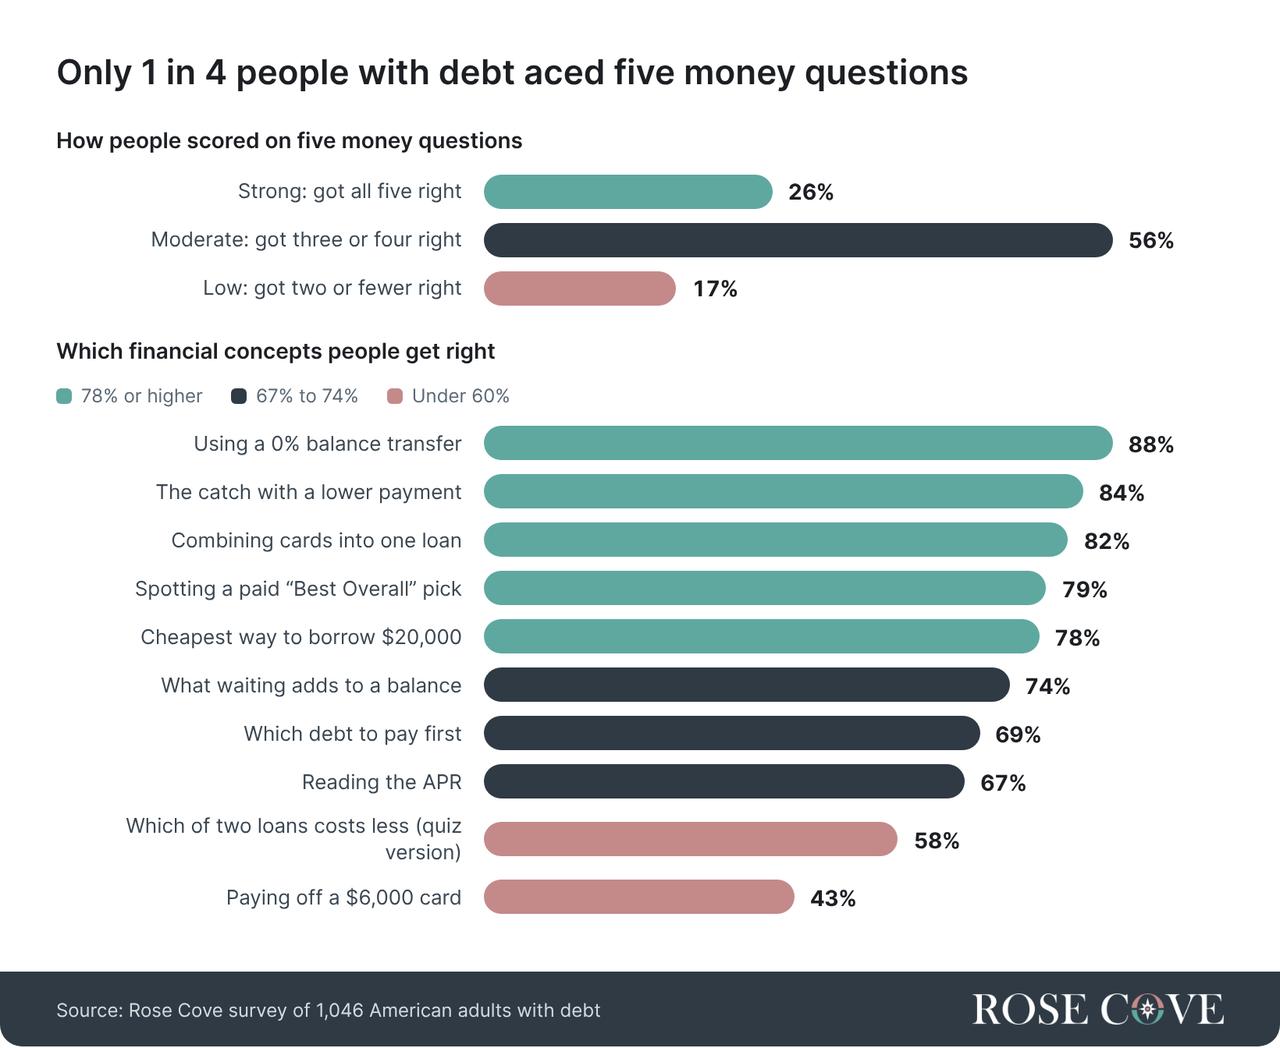
About 1 in 4 people (26%) showed strong financial literacy, getting every money question right. More than half (56%) landed in the middle, and about 1 in 6 (17%) scored low.
Most answered correctly on questions about a 0% balance transfer (88%) and combining credit card debts into one lower-rate loan (82%). Only 43% answered the $6,000 credit card payoff question correctly.
Quiz scores also lined up with differences in how people chose financial products. Compared with people in the strong group, those in the low group were:
- More likely to take the first offer shown: 19% vs. 8%
- More likely to use a ranked list for their last card or loan: 22% vs. 6%
- More likely to trust a “Best of” list at least somewhat: 58% vs. 44%
- Less likely to follow an AI payoff plan they made: 27% vs. 57%
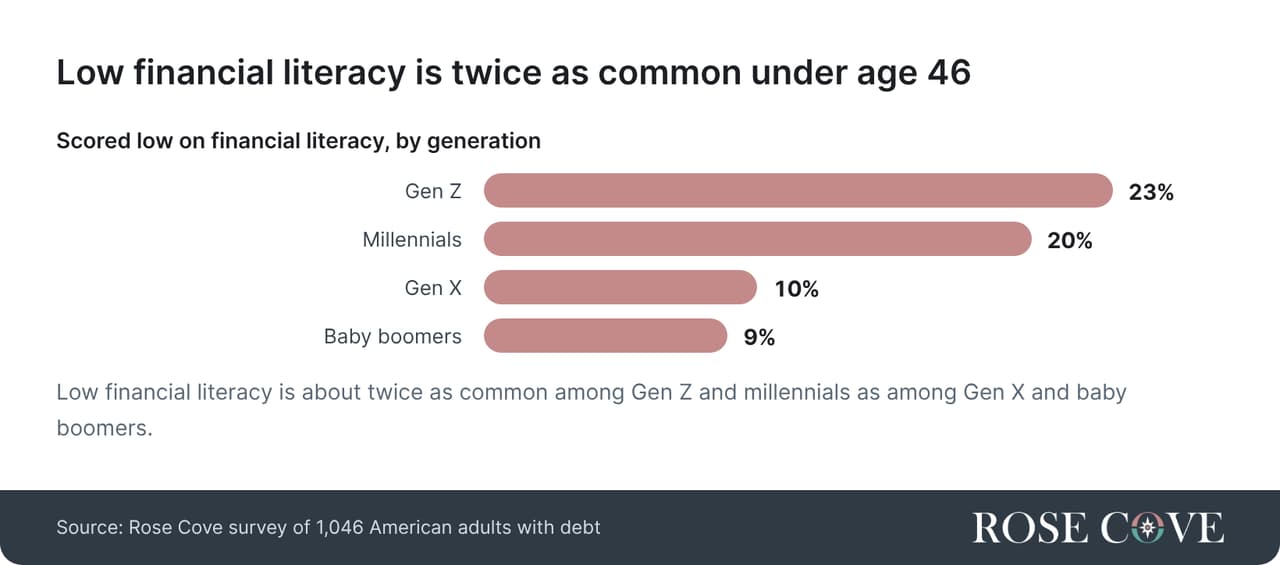
Low scores were more common among younger people. About 23% of Gen Z and 20% of millennials fell into that group, compared with 10% of Gen X and 9% of baby boomers. The results show where clear explanations and guidance could help people choose with more confidence.
People don’t lack options. They lack a clear next step.
The best option depends on your situation, not on a list. Your balances, rates, and goals decide what fits, and the same choice can help one person and cost another.
People want to see their options side by side, and few want a single pick handed to them. But under pressure, they default to minimum payments, ranked lists, and first offers. That is where people get stuck, and where clear guidance helps.
People don’t want us to choose for them. They want to see why one move fits better than another. Next Best Move shows you the comparison and the reasoning, so you can decide in minutes instead of months.
Rose Cove starts with your situation. Tell us where you stand, and we help you build a personalized Plan and find your Next Best Move. We show why it fits, what it costs, and how it compares, so you can decide with confidence.
Rose Cove may earn a commission from some partners. It never changes the move we recommend. See how we make money.
Methodology
- Basis
- We surveyed 1,046 American adults with debt about these decisions.
- Sample size
- 1,046
Rose Cove surveyed American adults with debt about borrowing and paying down balances. Eligible respondents carried debt such as a credit card balance, loan, mortgage, medical debt, or buy now, pay later balance.
We asked which debt decisions they had delayed and why. We also asked about staying at higher interest rates, choosing cards and loans, and trusting financial product rankings. Respondents each answered five financial literacy questions, drawn in matched pairs from a set of 10, so each concept’s result reflects the roughly half of respondents who saw it (485 to 522 people). The “by their own answers” delay figure combines three self-reported questions. Results relied on respondents’ accounts of their behavior and were not verified against financial account records.
The sample included Gen Z (17%), millennials (51%), Gen X (25%), and baby boomers (8%). Generations were based on reported age. Percentages may not total 100% because of rounding.
About Rose Cove
Rose Cove is a consumer financial guidance platform. Instead of listing products and leaving you to choose, it starts with your situation and shows your Next Best Move℠. Founded by Eric Barba, Rose Cove turns money decisions into clear next steps.
Fair use statement
You are welcome to share these findings and visuals for noncommercial purposes. Please credit Rose Cove and link back to this page so readers can see the full study and methodology.